Measurement
Part of When to question your PPC agency's measurement and reporting
How to spot PPC agencies measurement mistakes in your account
Nine measurement mistakes PPC agencies make, from vanity metrics to channel silos, plus a checklist for English advertisers reviewing paid search reporting.
What to take away
- Measurement mistakes are reporting and tracking faults that make paid search look better or worse than it is, and they survive because clients rarely audit the data pipeline.
- The most common are vanity metrics, broken conversion tracking and channel silos where each platform counts the same sale.
- Inclusion criteriafaults that distort spend, revenue or lead reporting and can be fixed with named evidence. The geography is England, where the CMA consumer protection guidance applies.
- Use the checklist before you sign or renew a retainer, and read the PPC agencies: measurement and reporting guide 2027 for the wider method.
Vanity metrics in reports
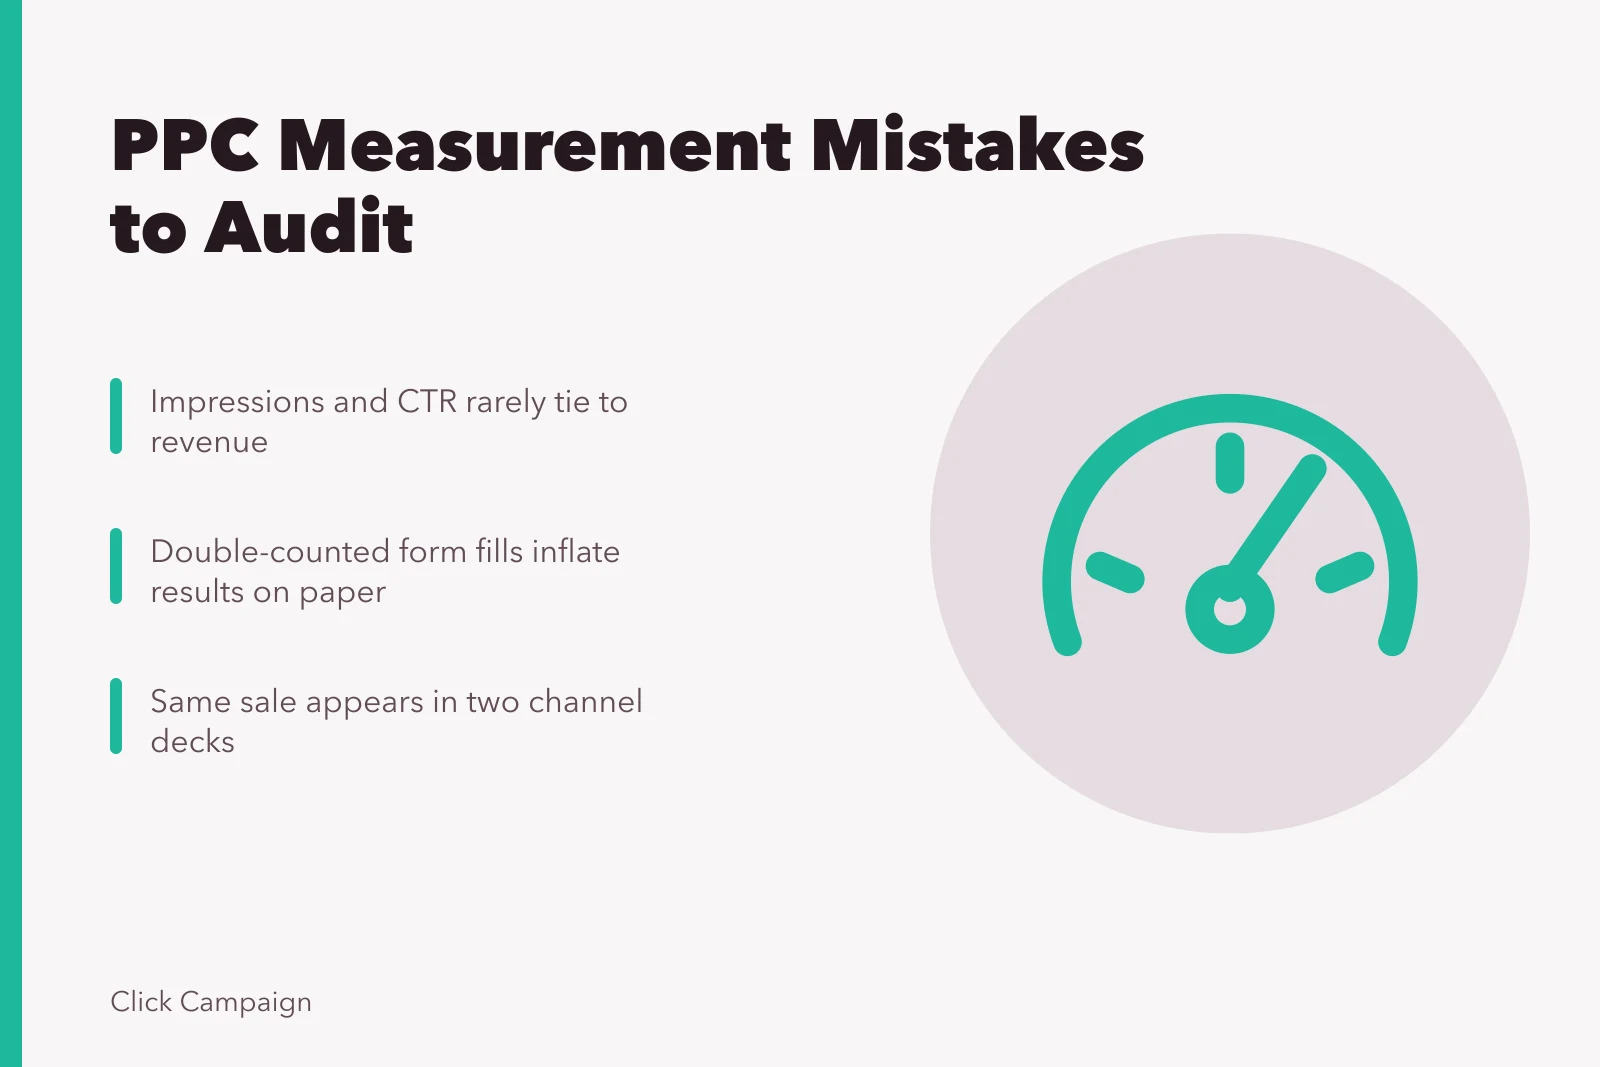
Impressions, click-through rate and average position feel like progress. They rarely tie to revenue, and a dashboard that opens with impressions shows only that the agency can pull a report.
Vanity vs revenue metrics
Vanity metrics
- Impressions
- Yes
- Click-through rate
- Yes
- Average position
- Yes
- Conversions
- No
- Revenue
- No
Revenue metrics
- Impressions
- No
- Click-through rate
- No
- Average position
- No
- Conversions
- Yes
- Revenue
- Yes
Ask which single metric the account manager would keep. If it is not a conversion or revenue figure, the reporting hierarchy needs rebuilding.
Broken conversion tracking
Double-counted form fills, test submissions and internal traffic inflate results. A tag fires twice, or a thank-you page reloads, and the cost per lead falls on paper only. Only a reconciliation with the client's own systems exposes the fault.
Broken conversion tracking
- Tag fires twice
- Form fill double-counted
- Test submission counted
- Internal traffic counted
- Thank-you page reloads
- Cost per lead falls on paper
- Reconcile with client systems
For Google Ads accounts, GA4 guidance on setting up ecommerce events sets out how purchase and lead events should be configured before anyone reports on them. Where paid social runs alongside search, Meta's explanation of ad auctions covers how delivery and conversion signals interact.
Channel silos
Search, shopping and paid social often get separate reports with separate conversion definitions. The same sale appears in two decks, so the client pays twice for one result.
Agree one conversion definition across channels before the next reporting cycle starts.
Last-click attribution only
Last-click gives full credit to the final click, so upper-funnel search and social activity disappears from the numbers. Budget then shifts to brand terms that would have converted anyway.
A defensible report shows a second attribution model alongside last-click, with the gap explained plainly rather than buried in a footnote.
Blended cost per acquisition
One blended figure hides the campaigns losing money. A strong brand campaign can mask a weak prospecting one for months.
Segment cost per acquisition by campaign type and show spend next to it. A blended figure that cannot be broken down is decorative.
No agreed baseline
Without a pre-campaign baseline, any result looks like an improvement. The agency compares this month with last month instead of a documented starting point.
Agree the metric, period and source system before work begins, so the first report has something honest to measure against.
Claims that outrun evidence
Ad copy and reporting claims about savings, rankings or results must be substantiated. The CMA consumer protection guidance for businesses covers unfair commercial practices, including misleading claims, and applies to how agencies present performance.
A claim that cannot be traced to a named source or client data should not appear in a pitch or a report.
No change log
Budgets, bids, audiences and landing pages change constantly. Without a dated change log, nobody can explain why performance moved.
A short dated log of what changed and who approved it turns a confusing month into an explainable one.
Reporting dashboard drift
The dashboard the client sees drifts from the one the agency uses internally. Definitions change quietly, and two people quote different numbers in the same meeting.
A single agreed source, reviewed on a fixed cycle, prevents that. The PPC agencies reporting dashboard in England guide covers keeping the client view and the working view aligned.
Pre-signature checklist
- Conversion tracking tested end to end, with test submissions excluded.
- One conversion definition agreed across every paid channel.
- Cost per acquisition segmented by campaign type, not blended.
- Baseline metric, period and source documented in writing.
- Attribution model stated, with last-click shown alongside it.
- Change log maintained and shared each reporting period.
- Every performance claim traceable to a named source or client data.
- Dashboard definitions identical for client and agency views.
Common questions
Are these mistakes more common with small agencies?
Size is not the predictor. Faults cluster where reporting is copied from a template and never reconciled with client systems, whatever the headcount.
Does the CMA guidance apply to agency reporting?
It applies to commercial practices that could mislead, which can include performance claims made to clients and prospects. The guidance is written for businesses, so read it directly.
How often should tracking be retested?
At minimum after any website change, tag update or new campaign launch. A quarterly retest catches drift that monthly reports would hide.