Measurement
Part of When to question your PPC agency's measurement and reporting
Check what PPC agencies benchmark research can and cannot tell you
PPC benchmark studies from LocaliQ, Databox, GA4 and Microsoft can frame a range, but only your definitions, sample and date range make a figure safe to quote.
What to take away
- Decide what the figure must justifya fee, a target, or a budget line. The definition matters more than the number.
- Ask every source for its sample, date range and currency before you quote it to a client.
- Treat a published average as a hypothesis to test in your own account, not a target to promise.
- Write the conversion definition and attribution window into the reporting contract, so the same argument does not restart each month.
- Expect a wide spread rather than one right answer, and report the range alongside the average.
What benchmark research can and cannot do
Benchmark research answers one narrow question: how does a comparable set of accounts behave? It cannot say what your account should achieve. Name the decision it supports before you quote a figure. A budget increase, fee review and target reset each need different evidence.
Lock definitions before quoting
- Name the decision it supports
- Define which conversions count
- Set the attribution window
- State if spend includes fees
- Check consent and retention rules
Lock definitions first. A £40 cost per acquisition means little until you know which conversions count, the attribution window, and whether spend includes management fees. Two agencies can quote £40 and mean different things.
Tracking choices sit inside the law. The Data Protection Act 2018 governs how audience data gathered for paid search may be held and used. Consent and retention decisions shape what a study can include. Those definitions need a home, and the reporting dashboard build is usually where they end up.
Named benchmark sources
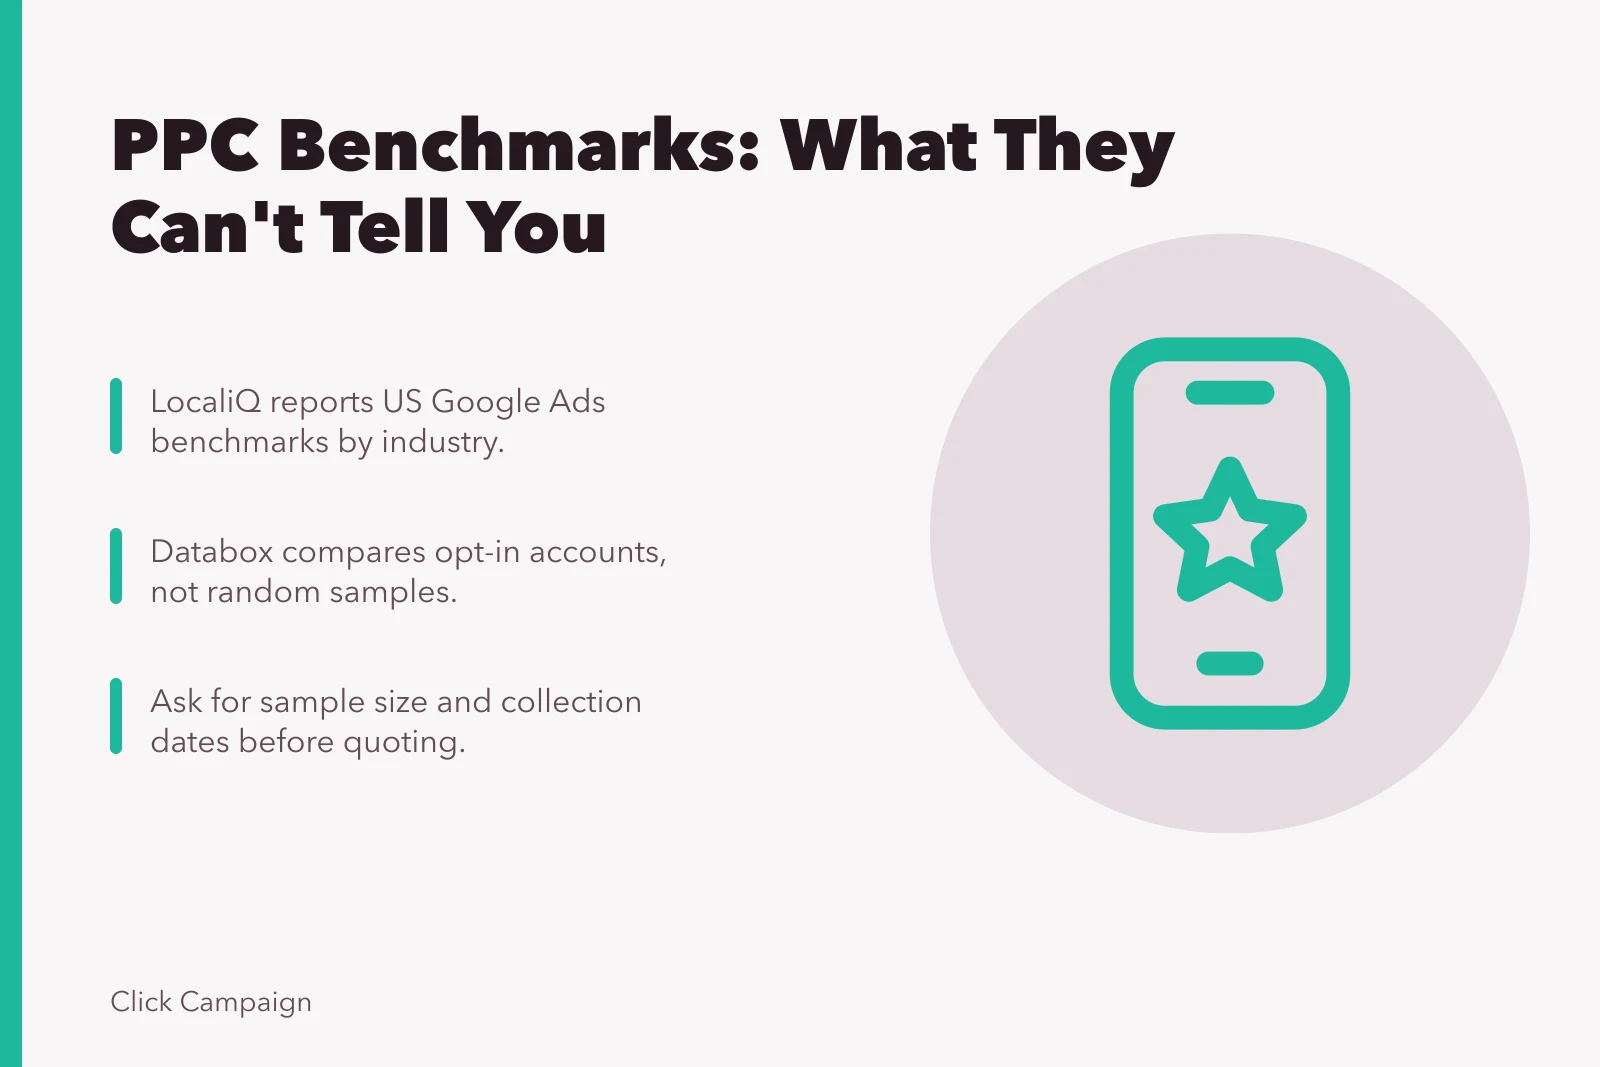
LocaliQ, formerly WordStream, publishes annual Google Ads benchmarks by industry. It reports average click-through rate, cost per click, conversion rate and cost per lead. The data is US-focused, so use it as a range, not a UK target.
What each benchmark source covers
Source
- LocaliQ
- Google Ads by industry
- Databox
- Google and Facebook Ads
- GA4
- Peer property comparison
- Microsoft
- Microsoft Ads by country
- Semrush / SpyFu
- Competitor estimates
Coverage
- LocaliQ
- US-focused, use as range
- Databox
- Opt-in sample, not random
- GA4
- Requires opt-in sharing
- Microsoft
- Not a Google proxy
- Semrush / SpyFu
- Modelled, not audited
Caveat
- LocaliQ
- Databox
- GA4
- Microsoft
- Semrush / SpyFu
Databox Benchmarks compares your connected accounts with anonymous aggregated data. It covers Google Ads and Facebook Ads. The sample depends on opt-in users, so it is not random.
Google Analytics 4 benchmarking reports compare your property with peers for some industries. They require opt-in data sharing. Access varies by industry and region.
Microsoft Advertising publishes industry benchmarks inside its platform. Figures are split by country and industry, including click-through rate and conversion rate. Use them for Microsoft Ads, not as a Google proxy.
Semrush Advertising Research and SpyFu estimate competitor paid search activity. They show keywords, ad copy and estimated spend or clicks. Those are modelled figures, not audited client results.
Six steps to scope research you can defend
Six steps to scope research
- Name the decision the study must support and who will act on it.
- Define conversions, attribution window and whether spend is media only.
- Set sector, country and account size band.
- Ask for sample size and collection dates. Undated figures are unusable.
- Test the average against your account before quoting it. The gap is the finding.
- Record definitions in the reporting pack so next quarter uses the same yardstick.
Where published averages break down
Most studies rely on agencies that chose to submit, so the sample reflects confident teams. That bias is worth naming in any board paper.
Settings travel with the numbers. Networks, locations, budgets and bidding choices change how ads serve and cost, and Google's guidance on campaign settings sets out those controls. Two accounts with different settings are not directly comparable.
Currency and region add another layer. A UK-wide figure blends Scottish, Welsh and Northern Irish markets with English ones. If your client trades in one English city, a national average may be the wrong yardstick.
Make benchmarking a routine, not a project
Two habits keep the work honest. Date every figure you store. Note what was excluded, such as brand campaigns or non-UK traffic. Exclusions explain most of the gap between a published average and your own account.
Run the same definitions across your accounts each quarter and watch the spread. CIM's strategy and planning courses cover how to set an objective before choosing a number. The wider measurement and reporting guide covers how those definitions carry through to client reporting.
Common questions
How many accounts does a benchmark need?
Enough that one strong or weak performer cannot move the average. Ask the publisher how the sample was recruited, because studies built from voluntary submissions over-represent agencies with healthy results.
Should an English account be measured against UK figures?
Only with care. National averages mix markets with different costs and competition, so compare like with like on sector, spend band and channel mix before you draw a conclusion.
How often should benchmark research be refreshed?
Annually is usually enough for planning, with a quarterly check on your own account data. Platforms change settings and bidding options, so a two-year-old figure can mislead a client about what is achievable.